Short answer: I built a working global beer sensory tool. Breweries’ tasters submit flavor scores, and everyone sees how far each batch drifts from its style’s world “ideal.” It runs on Microsoft Fabric, and the entire backend (database, API, sign-in, row-level security, hosting) was deployed in one command with Rayfin, Microsoft’s new Fabric Apps SDK from Build 2026. The interesting part isn’t the radar charts; it’s that the operational app and the analytics model sit on the same platform, sharing one 16-axis sensory model, so “what does the world think of this style” and “is my batch on-spec” are answered from the same numbers.
I’ve been writing about putting brewery operations on Microsoft Fabric: the 3D brewery digital twin and the maltery twin. This one is about the other half of quality: not the tanks and temperatures, but the taste. Here’s what I built, what it shows, and how you’d actually use it.
What it is
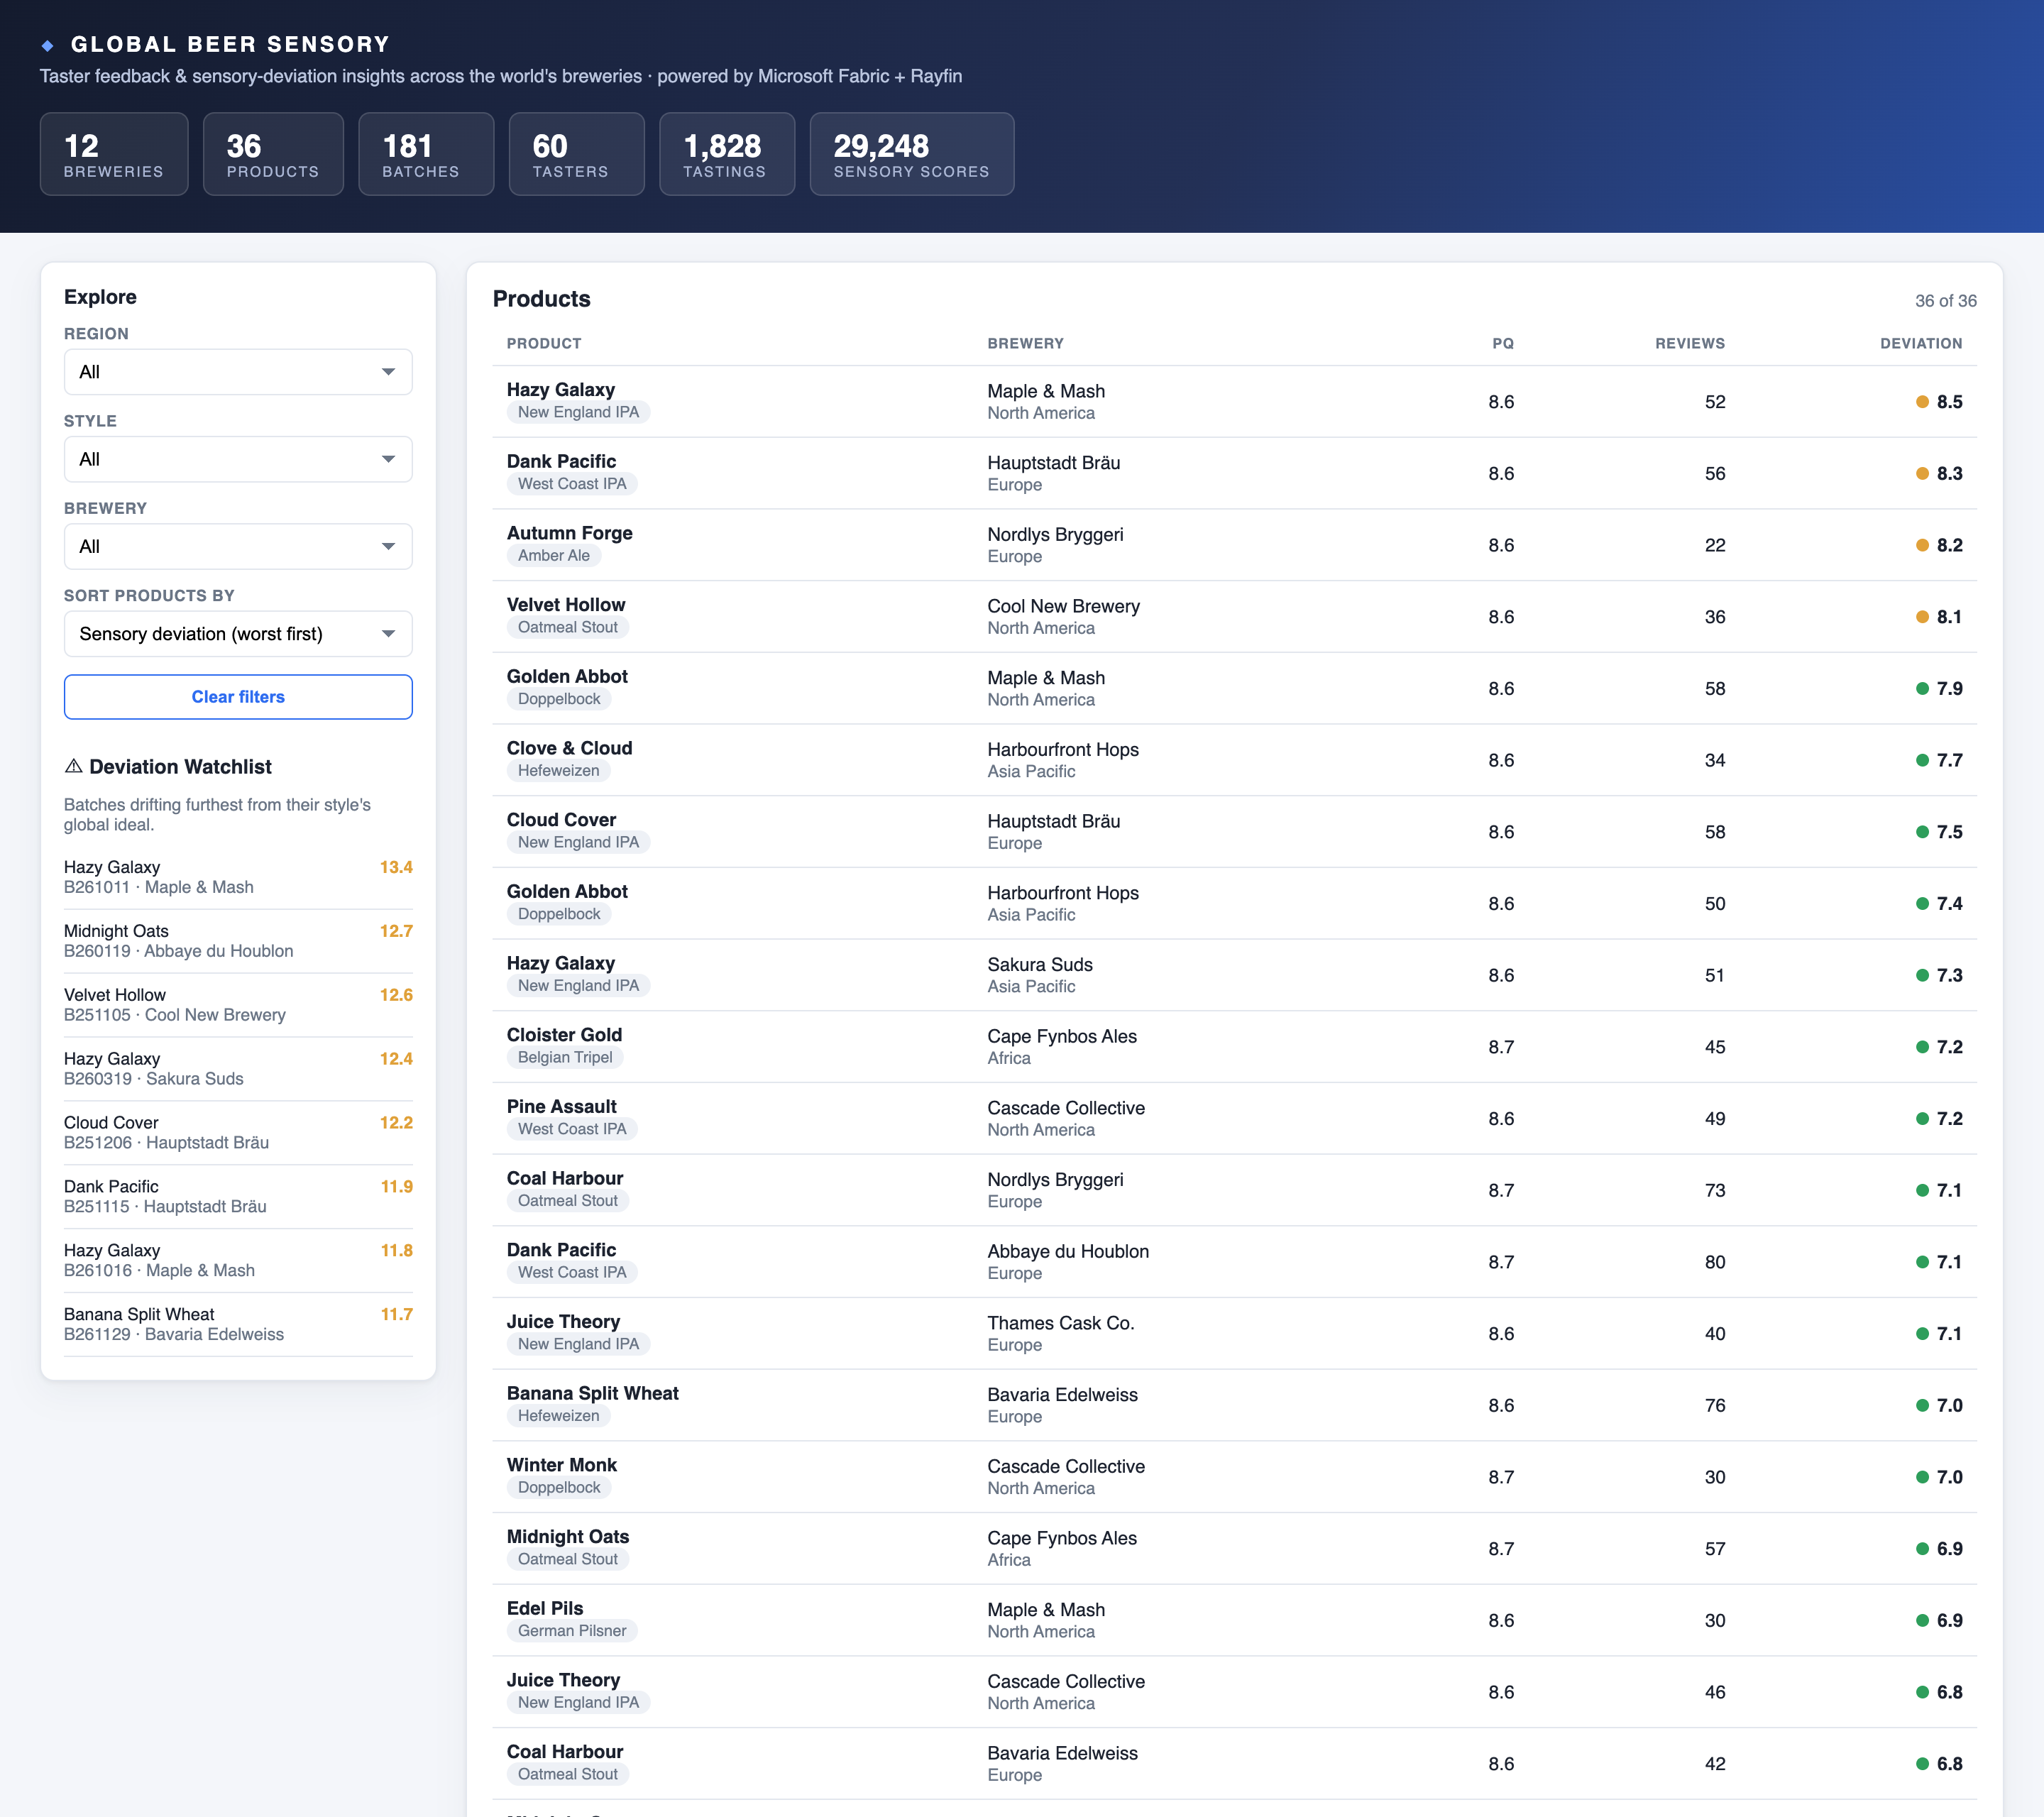
Every tasting in the tool scores a beer on 16 flavor axes (sweet, sour, bitter, umami, fruity, floral, roast, hops, malt, caramel, yeast, body, and a few more), each from 0 to 100. For every style there’s an agreed “ideal” profile: what a Doppelbock or a New England IPA is supposed to taste like. The single number that matters is deviation: the average distance between a batch’s measured profile and its style ideal. Low deviation means on-style; high deviation means the batch is wandering, and the radar shows exactly which flavors pulled it off.
The home screen is a global leaderboard. Twelve breweries, thirty-six products, every batch ranked by how far it strays, with a deviation watchlist flagging the worst offenders worldwide.
How you use it
Pick a product and you get the diagnosis. The radar overlays three things: the batch you’re looking at (solid), the style ideal it’s judged against (dashed red), and the world average for that style (dotted grey). Where the solid line bulges past the dashed one, that flavor is too strong; where it caves in, it’s too weak. A brewer reads this in about three seconds, far faster than a table of sixteen numbers.
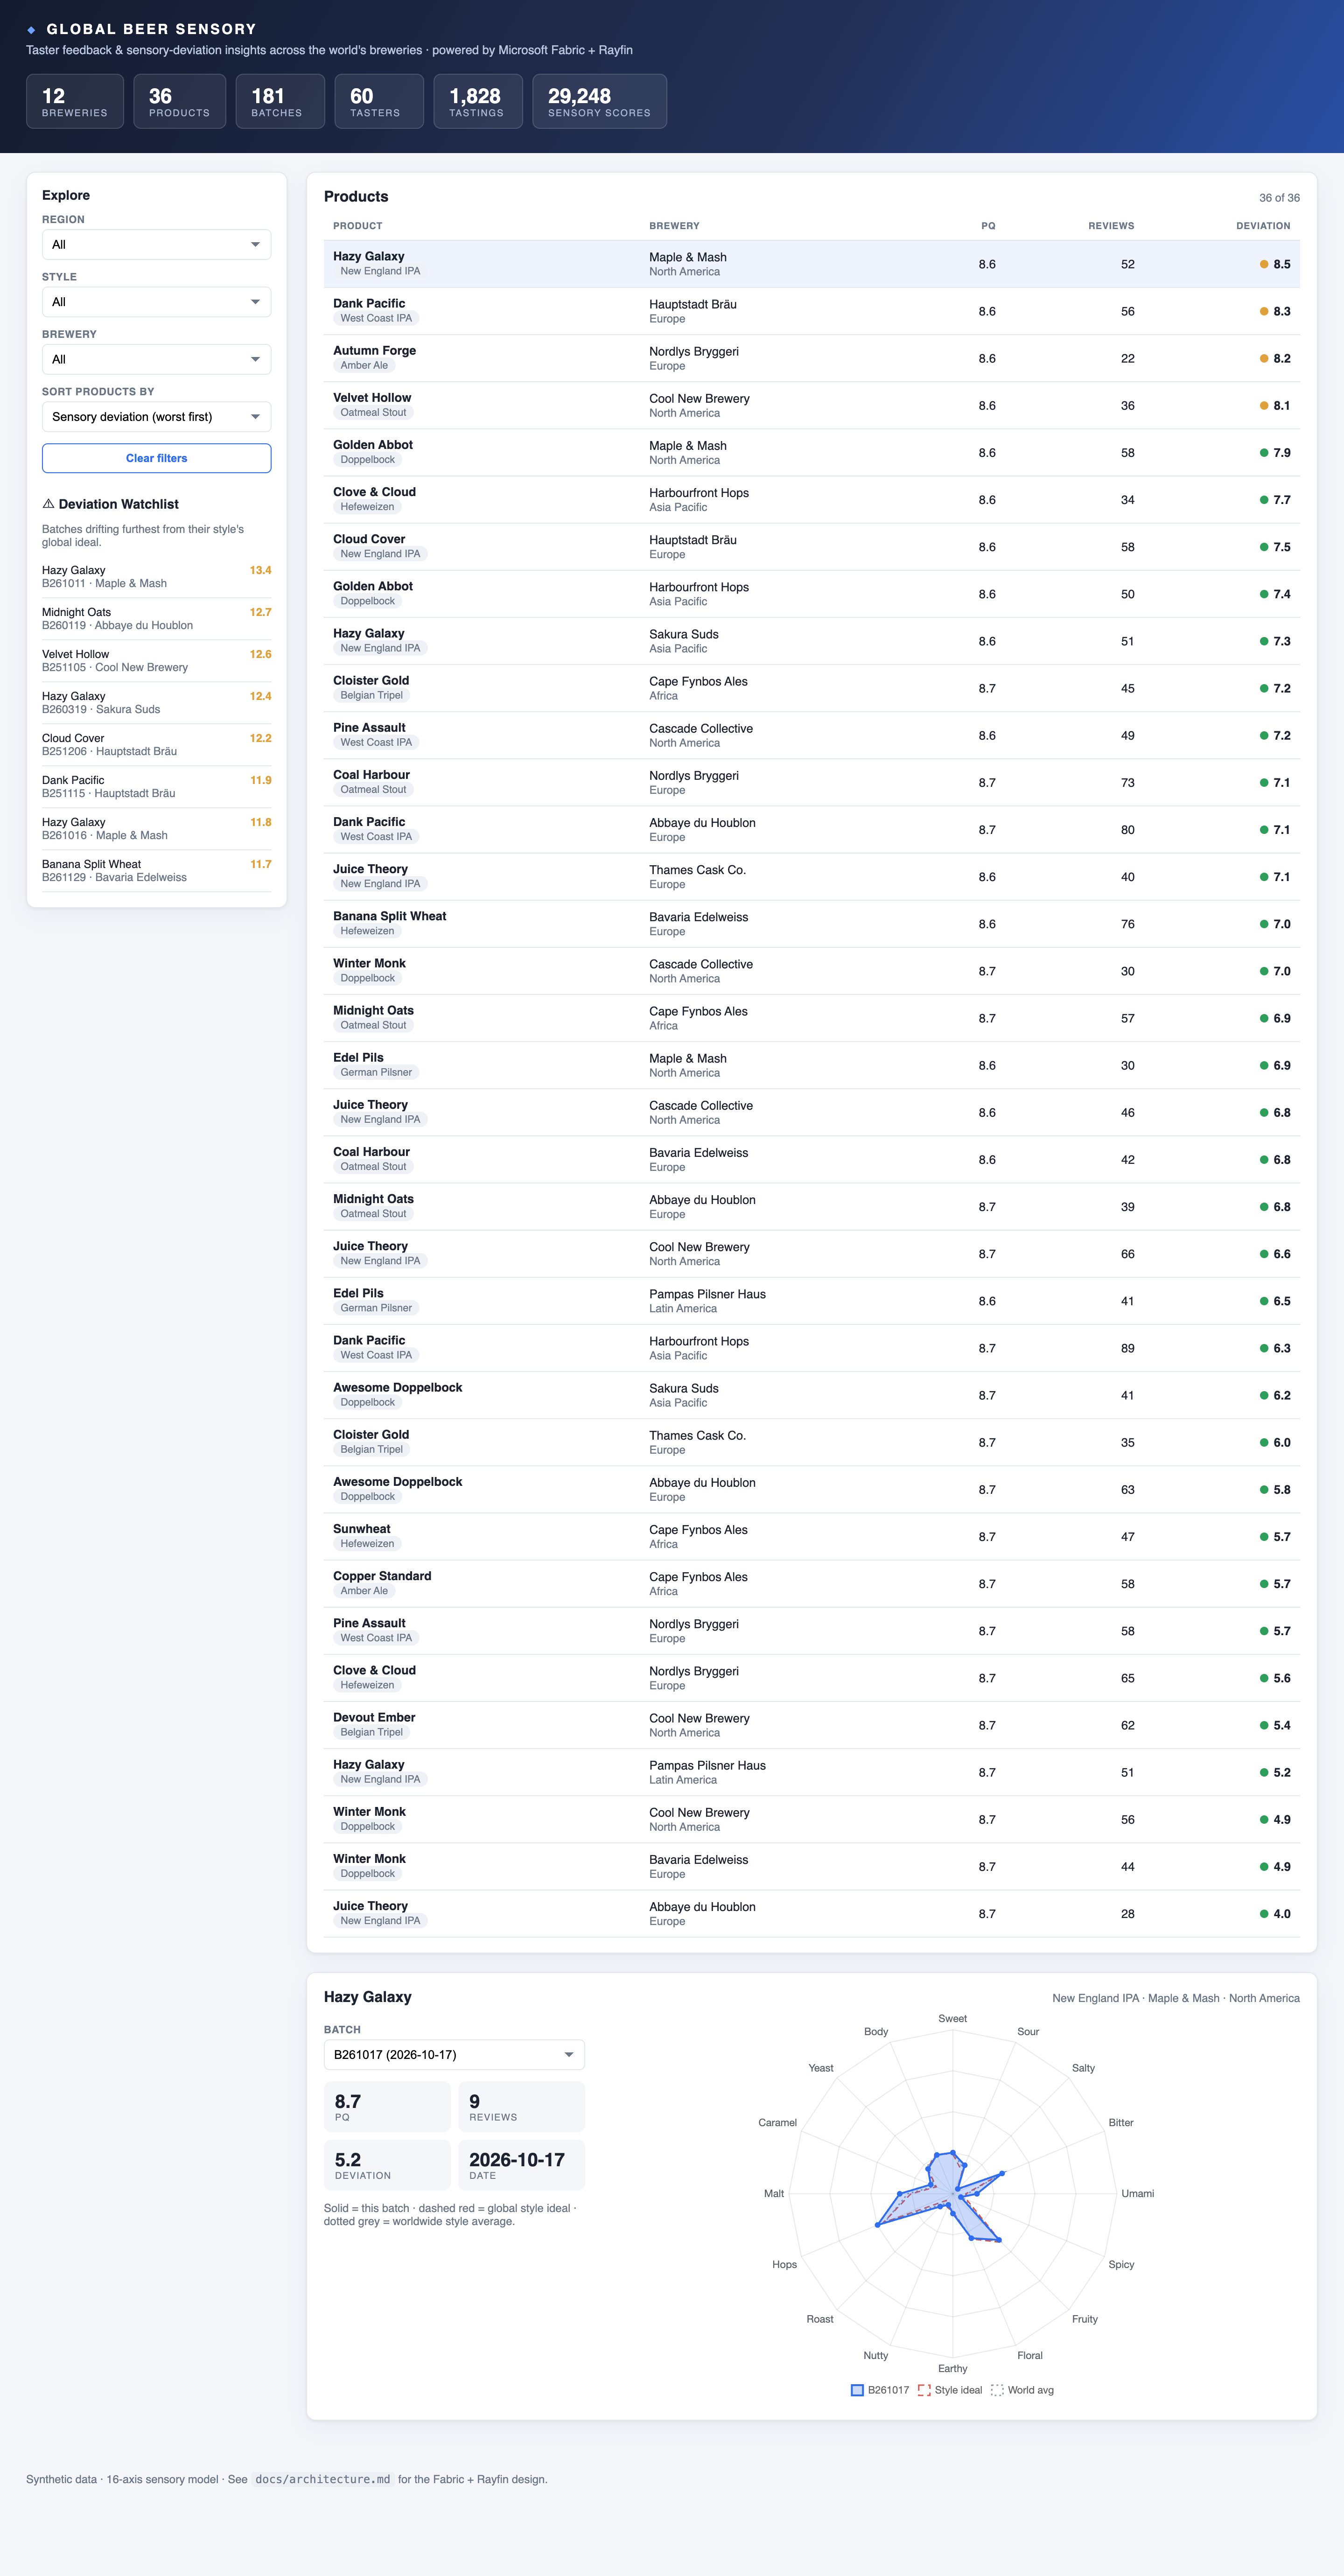
The same 16-axis model drives a brewer-facing producer panel too, comparing two of your own products side by side, or a single product against the world. The radar is the lingua franca of sensory work, and keeping every view on the same axes is what makes “your batch” and “the world” directly comparable.
The part that’s actually new: Rayfin
The charts are the easy bit. The interesting bit is how it’s hosted. At Build 2026 Microsoft shipped Rayfin, an open-source SDK and CLI for Fabric Apps. You describe your backend in TypeScript (the data models, who can read what), and one command provisions all of it on Microsoft Fabric.
My entire data model is a handful of decorated TypeScript classes:
@entity()
@role('authenticated', '*')
export class FlavorScore {
  @uuid() id!: string;
  @one(() => Tasting) tasting!: Tasting;
  @text({ max: 16 }) axis!: string;
  @int() score!: number;          // 0 to 100
}
Then:
npx rayfin up
That one command created a SQL database, generated a GraphQL API, wired up Entra single sign-on, applied row-level security, and hosted the front end, all as a governed Fabric item with direct access to OneLake. No portal clicking, no infrastructure tickets. The app went live at a fabricapps.net URL in well under a minute. This is the same instinct behind the digital-twin work: keep the operational app and the analytics on one platform so the data never has to be copied to be trusted.
Why that matters for sensory data specifically: row-level security means each brewery sees only its own raw tasting scores, while everyone still sees the anonymized global benchmark. That’s the exact trust model a shared, cross-brewery sensory database needs: private where it must be, communal where it helps.
Where this breaks
The honest caveats, because the demo is prettier than reality. The data is synthetic. I generated twelve breweries and ~29,000 scores with a fixed seed so the deviation analytics have signal; real panel data is messier, sparser, and full of tasters who disagree. A “style ideal” is an opinion, not a law. Someone has to decide what a Doppelbock should taste like, and that number is a judgement call you’ll argue about; the tool makes the disagreement visible, it doesn’t settle it. Deviation flags difference, not badness. A batch can stray from the style ideal on purpose and still be a great beer, so the number is a prompt to taste, never a verdict. Tasters are instruments that drift. Without calibration, “deviation” can be measuring your panel’s inconsistency rather than your beer’s; the model tracks taster reliability for exactly this reason, but you still have to act on it. And Fabric Apps is preview. Rayfin is new, Entra-SSO-only once deployed, and not where you’d put regulated data without reading the fine print.
The bottom line
A global beer sensory tool isn’t hard because of the math; average distance from an ideal is arithmetic. It’s hard because it needs somewhere trustworthy for many breweries to pool sensitive taste data, with privacy where it matters and a shared benchmark where it helps. That used to be weeks of backend plumbing. With Rayfin on Microsoft Fabric it was one command, and the result sits on the same platform as the analytics, sharing one sensory model. The radar tells a brewer which flavor is off and how far; the platform makes it safe to ask that question across the whole industry at once. If you’re building toward this, start where I always say to start, with a data foundation you trust, then let the sensory layer sit on top of numbers that are already clean.
Frequently asked questions
What is a beer sensory deviation tool? It’s an analytics tool that scores each batch of beer across a fixed set of flavor axes (sweet, bitter, hops, roast, body, and so on) and measures how far that batch drifts from the agreed “ideal” profile for its style. The deviation number tells a brewer at a glance whether a batch is on-style or wandering, and the radar chart shows exactly which flavors are off.
What is Rayfin and how does it relate to Microsoft Fabric?
Rayfin is Microsoft’s open-source SDK and CLI, announced at Build 2026, that lets you define an application backend (data models, APIs, auth, access rules) in TypeScript and deploy it straight onto Microsoft Fabric with one command (npx rayfin up). It provisions the database, GraphQL API, Entra sign-in, and row-level security as a governed Fabric item with direct access to OneLake, so the app and the analytics live on the same platform.
Can a brewery use this with its own tasting data? Yes, that’s the point. The tool uses a synthetic global dataset for the demo, but the 16-axis model and the deviation math work on any panel data. A brewery lands its own tasting scores in OneLake, points the semantic model at them, and gets the same deviation insights for its products while row-level security keeps each brewery’s raw data private.